The power of data()
We left off with a simple bar chart, drawn with divs and generated from our simple data set.
var dataset = [ 5, 10, 15, 20, 25 ];

This is great, but real-world data never looks like this. Let’s modify our data.
var dataset = [ 25, 7, 5, 26, 11 ];

We’re not limited to five data points, of course. Let’s add more!
var dataset = [ 25, 7, 5, 26, 11, 8, 25, 14, 23, 19,14, 11, 22, 29, 11, 13, 12, 17, 18, 10,24, 18, 25, 9, 3 ];

25 data points instead of five! How does D3 automatically expand our chart as needed?
d3.select("body").selectAll("div").data(dataset) // <-- The answer is here!.join("div").attr("class", "bar").style("height", function(d) {var barHeight = d * 5;return barHeight + "px";});
Give data() ten values, and it will loop through ten times. Give it one million values, and it will loop through one million times. (Just be patient.)
That is the power of data() — being smart enough to loop through the full length of whatever data set you throw at it, executing each method below it in the chain, while updating the context in which each method operates, so d always refers to the current datum at that point in the loop.
That may be a mouthful, and if it all doesn’t make sense yet, it will soon. I encourage you to save the source code from the sample HTML pages above, tweak the dataset values, and note how the bar chart changes.
Remember, the data is driving the visualization — not the other way around.
Random Data
Sometimes it’s fun to generate random data values, for testing purposes or pure geekiness. That’s just what I’ve done here. Notice how each time you reload the page, the bars render differently.

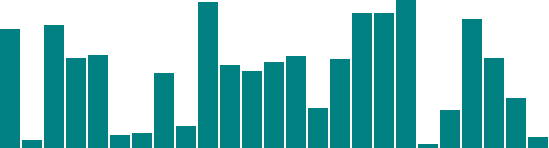

View the source, and you’ll see this code:
var dataset = []; //Initialize empty arrayfor (var i = 0; i < 25; i++) { //Loop 25 timesvar newNumber = Math.random() * 30; //New random number (0-30)dataset.push(newNumber); //Add new number to array}
This code doesn’t use any D3 methods; it’s just JavaScript. Without going into too much detail, this code:
- Creates an empty array called
dataset. - Initiates a
forloop, which is executed 25 times. - Each time, it generates a new random number with a value between zero and 30.
- That new number is appended to the
datasetarray. (push()is an array method that appends a new value to the end of an array.)
Just for kicks, open up the JavaScript console and enter console.log(dataset). You should see the full array of 25 randomized data values.
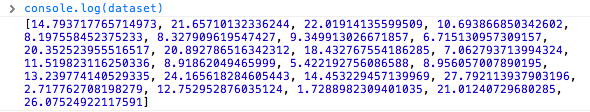
Notice that they are all decimal or floating point values (14.793717765714973), not whole numbers or integers (14) like we used initially. For this example, decimal values are fine, but if you ever need whole numbers, you can use JavaScript’s Math.round() method. For example, you could wrap the random number generator from this line
var newNumber = Math.random() * 30;
as follows:
var newNumber = Math.round(Math.random() * 30);
Try it out here, and use the console to verify that the numbers have indeed been rounded to integers:

Next we’ll expand our visual possibilities with SVG.