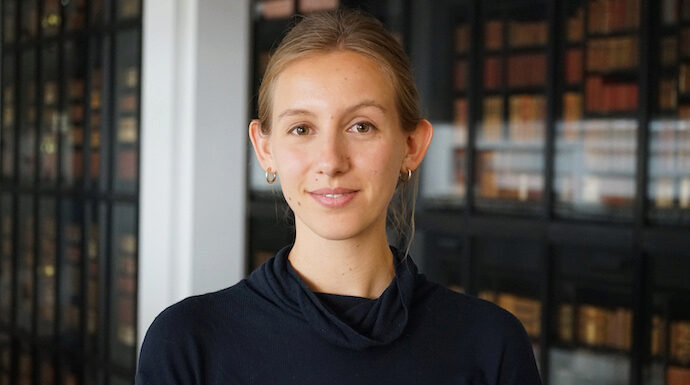
I am a data visualisation designer and JavaScript engineer based in London. I work at The Economist in the data journalism team where I build interactives.
Much of my work has been creating visualisations of large cultural datasets, for example digitised collections of paintings, photographs, artefacts, maps, and newspapers. I was a Research Software Engineer at the British Library and The Alan Turing Institute on the 'Living with Machines' research project. Before this, I did a PhD—'Timeline Design For Visualising Cultural Heritage Data'—at Royal College of Art. I have created visualisations for institutions including the V&A Museum, the Wellcome Library and the Nordic Museum, Stockholm. My PhD was funded by an AHRC scholarship from the London Doctoral Design Centre.
I am also an Ambassador and Featured Creator at Observable, and a Fellow of the Royal Society of Arts.
I was awarded a Smithsonian Fellowship at the Cooper Hewitt Design Museum, New York City in 2017. The interactive I developed out of this fellowship, ‘Dive into Color’, was exhibited at Cooper Hewitt in the exhibition ‘Saturated: The Allure and Science of Color’ in 2018.
Prior to this, I studied Physical Natural Sciences and History & Philosophy of Science at the University of Cambridge.
To get in touch: contact@oliviavane.co.uk / @OliviaFVane
Selected Talks
Visualising musical tastes across the world
A Year in Data, UCL Social Data Institute
2022
Waterlines
Observable Insight 2022
2022
Watch the video
Data visualisation at The Economist
Pelagios lecture
2022
Data visualisation at The Economist
Slovak Design Center, Bratislava
2022
Digital Storytelling for Cultural Heritage
Academy of Fine Arts and Design, Bratislava
2022
Design Dialogues: Design X Digital Collection
Royal Academy of Fine Arts (KASK) Gent & Design Museum Gent
2022
Watch the video
Telling Stories with Cultural Heritage Data
CUSP, Kings College London
2021
Maps in Time: Visualising the historical Ordnance Survey
Information+ Conference.
2021
Watch the video
Drawing Waterlines on Maps with Olivia Vane
Observable Livestream
2021
Watch the video
DataViz Demos with Contest Winners
Observable Livestream
2021
Watch the video
'Generous Interfaces' panel
Netherlands Film Festival
2020
Visualising cultural heritage collections: Is the data enough?information+visualization talk series, Fachhochschule Potsdam - University of Applied SciencesWatch the video2020
Designers — what are they good for (in data visualisation)? Information+ conference, Potsdam, GermanyWatch the video2018
Visualising cultural heritage collections British Library, London2018
Visualising the Cooper Hewitt collectionEuropeanaTech conference, Rotterdam2018
Timeline VisualizationsMax Planck Institute for History of Science, Berlin2018
Writing
Using JavaScript to make interactive data graphicsOff the Charts: The Economist's data journalism newsletter2022
How to visualise sensitive topicsOff the Charts: The Economist's data journalism newsletter2022
How we designed our Spotify interactiveOff the Charts: The Economist's data journalism newsletter2022
Macromap: Interactive Maps in TimeLiving with Machines blog2021
Heatmap for polygons: visualise overlaps in a large polygon datasetLiving with Machines blog2020
Post-Covid CurationThe Cambridge Humanities Review, Autumn 2020, Issue 16.2020
Design as externalization: Enabling researchBoyd Davis, S. and Vane, O.Information Design Journal 25(1), pp.28-42.2020
D3 JavaScript visualisation in a Python Jupyter notebookLiving with Machines blog2020
Strange Times: Visualising the Oddities of Time DataNightingale: The Journal of the Data Visualization Society2020
Timeline Design For Visualising Cultural Heritage DataPhD Thesis, Royal College of Art2019
Cultural Visualisation and the Value of SimplicityEuropeanaTech Insight2019
Making ‘Dive into Color’ Cooper Hewitt Labs blog2018
Visualising the Royal Photographic Society collection: Part 2 V&A Museum blog2018
Visualising the Royal Photographic Society collection V&A Museum blog2018
Text Visualisation Tool for Exploring Digitised Historical DocumentsVane, O.ACM SIGCHI Conference on Designing Interactive Systems (DIS 2018)Hong Kong2018
Exploring the Cooper Hewitt collection with timelines and tagsCooper Hewitt Labs blog2017
Using Data Visualisation to tell Stories about CollectionsDavis, S.B., Vane, O. and Kräutli, F.Electronic Visualisation and the Arts Conference (EVA 2016)British Computer Society, London, UK2016**Best Paper Award**
Exhibitions
Curator Computer CreatorThe Barbican Centre2019
Dive into Color exhibited in Design Research EvolutionLondon Design Festival2018
Dive into Color exhibited in Saturated: The Allure and Science of ColorCooper Hewitt Smithsonian Design Museum, New York City2018-2019
Workshops / Teaching
Data visualisation for cultural heritage collections courseN8 Centre of Excellence in Computationally Intensive Research2021
Data visualisation for cultural heritage collections courseBritish Library Digital Scholarship Training Programme2020-
Introduction to D3 workshopThe Alan Turing Institute2020
Visualising Cultural Heritage Collections with D3 workshopDigital Scholarship, British Library2019
Introduction to Creative Data Visualisation in D3 workshopRoyal College of Art2019